Study Notes: Social Network Analysis (Chapter 3)
1.3.1 Introduction to Networks
-
Definition: A network is a collection of things and their relationships to one another.
-
Components:
-
Vertices (Nodes): The “things” connected (people, items, institutions).
-
Edges (Ties/Links): The connections between the vertices.
-
-
Purpose: Visualize complex relationships as maps (sociograms) and calculate precise measures of size, shape, and density.
1.3.2 The Network Perspective
-
Relational vs. Attribute Data: Traditional social science focuses on individual attributes (age, gender). Network science focuses on the connective tissue—the relationships between individuals.
-
Location, Location, Location: An individual’s success is often determined by their position within a structure rather than internal abilities alone.
-
Social Metrics: Recognizes patterns like “popularity” (many connections) vs. “influence” (connections to other well-connected people).
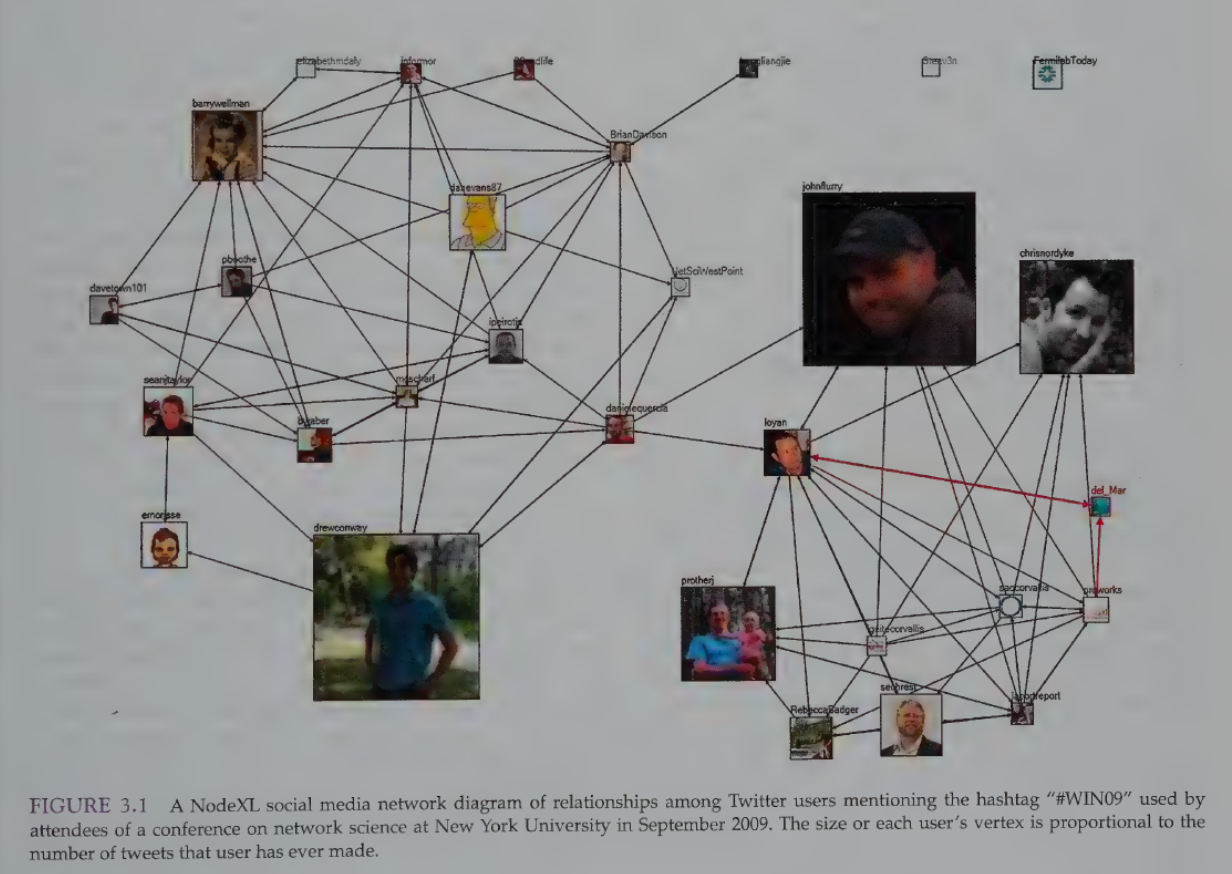
1.3.2.1 A Simple Twitter Network Example
-
Sociogram: A visual network graph.
-
Visual Overlay: Attribute data (like total tweet count) can be used to determine the size of a vertex in the graph.
1.3.2.2 Vertices and Edges
-
Vertex Attributes: Demographic data (race, age) or system data (logins, posts) can be mapped to visual properties like color or size.
-
Edge Types:
-
Directed (Asymmetric): Clear origin and destination (e.g., following someone on Twitter, sending an email). Represented by arrows.
-
Undirected (Symmetric): Mutual relationship with no direction (e.g., being Facebook friends, being married).
-
Unweighted (Binary): Simply shows if a tie exists (1) or not (0).
-
Weighted: Shows the strength or frequency of the tie (e.g., number of messages exchanged).
-
1.3.2.4 Data Representations
-
Adjacency Matrix: A table where rows and columns both represent individuals.
-
Edge List: A two-column list identifying pairs of connected vertices (Vertex 1 Vertex 2). This is the preferred format for NodeXL.
1.3.3 Types of Networks
-
Egocentric Networks: Focused on a single individual (Ego) and their connections (Alters).
-
1-degree: Ego + Alters.
-
1.5-degree: Ego + Alters + connections between those Alters.
-
2-degree: Ego + Alters + Alters’ friends.
-
-
Full vs. Partial: A full network includes everyone in a system; a partial network is a “slice” (e.g., users of a specific hashtag).
-
Unimodal vs. Multimodal:
-
Unimodal: One type of vertex (e.g., person-to-person).
-
Multimodal (Bimodal/Affiliation): Two or more types (e.g., people connected to the documents they edit).
-
-
Multiplex: Networks with multiple types of edges between the same vertices (e.g., two people who are both “coworkers” and “friends”).
1.3.4 & 1.3.5 Network Analysis Metrics
1.3.5.1 Aggregate Metrics (Whole Network)
-
Density: The percentage of all possible connections that actually exist. Measures cohesion.
-
Centralization: Measures how much the network revolves around a few key nodes.
1.3.5.2 Vertex-Specific Metrics (Individual Positions)
-
Degree Centrality: Simple count of total connections.
-
In-degree: Connections pointing to the vertex (popularity).
-
Out-degree: Connections pointing away (sociability).
-
-
Betweenness Centrality: Measures how often a vertex acts as a bridge on the shortest path between others. High scores indicate a broker role.
- Structural Hole: A gap between two groups; the person who fills this gap has high strategic value.
1.3. Closeness Centrality: The average distance (number of hops) from a vertex to all others. Low scores mean you are “close” to everyone.
-
Eigenvector Centrality: Influence score. You are central if you are connected to other highly central people (e.g., Google’s PageRank).
-
Clustering Coefficient: Measures the density of an individual’s 1.5-degree network (do your friends know each other?).
1.3.6 - 1.3.9 Historical and Technical Context
-
Small World Phenomenon: “Six Degrees of Separation”—most nodes can be reached in a small number of steps.
-
Weak Ties: Mark Granovetter’s theory that “weak ties” (acquaintances) are more useful for finding new information/jobs than “strong ties” (close friends).
-
Dunbar’s Number: The theoretical biological limit of ~150 stable social relationships.
-
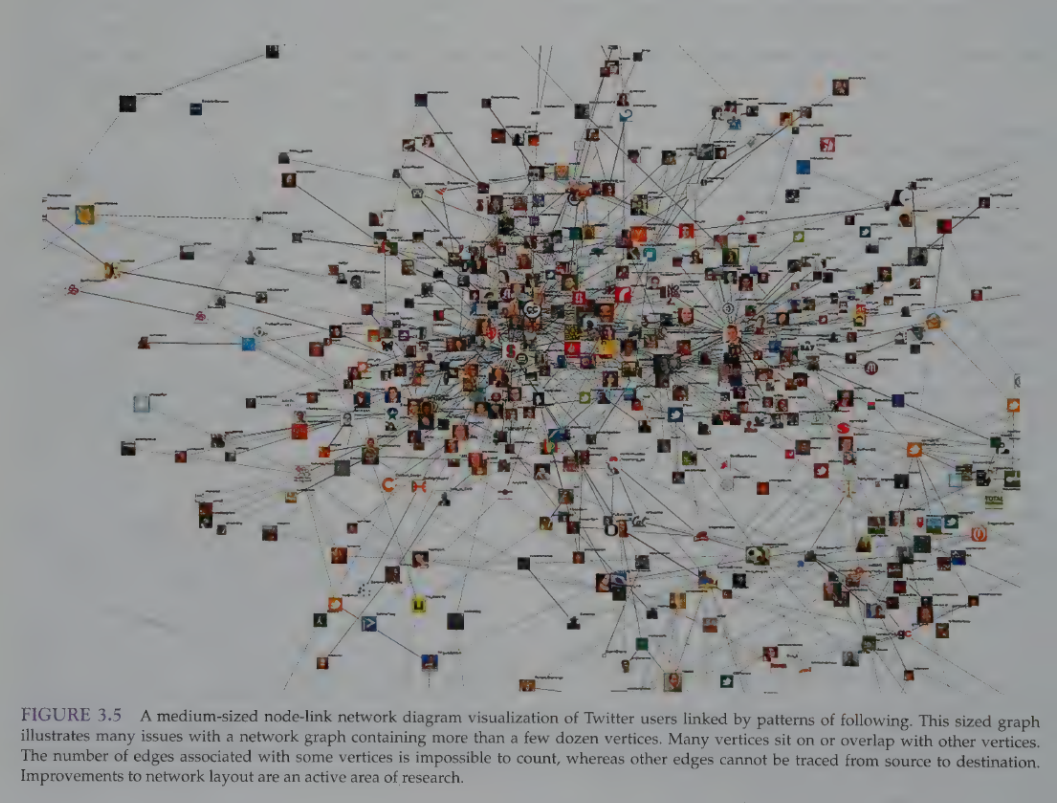
Netviz Nirvana: The ideal state of a visualization where every vertex/edge is visible, clusters are identifiable, and outliers are clear.
1.3.10 Common Exam/Research Questions
-
Social Roles: Who is the “Answer Person” or the “Boundary Spanner”?
-
Influencers: Who helps new ideas propagate?
-
Community Health: How do structures change after events like layoffs or mergers?
Study Tip: Focus on the difference between Betweenness (brokering/bridging) and Eigenvector (influence by association). These are common points of confusion in SNA exams.