View PDF
SNA 1.1
Introduction to Social Media and Social Networks
1.1.1 Key Concepts & Definitions
Social Media: Tools (email, blogs, wikis, etc.) where billions of people create trillions of connections daily. These platforms make previously “invisible” ties visible and machine-readable.
Social Network Analysis (SNA): The application of Network Science to human relationships. It uses mathematical techniques and computer programs to map the shape and key locations within a landscape of links.
Social Networks: Collections of connections among groups of people and things. They are “primordial”—they existed long before the internet through any exchange of help or information.
1.1.2 Historical & Scientific Context
Network Science: The study of patterns in physical systems (chemical/genetic), biological systems (food webs), and human phenomena (markets, trust, collective action).
Scientific Evolution:
Measurement: Similar to Lord Kelvin’s emphasis on measurement to advance science.
Mathematics: Social scientists are developing math for network evolution/decay, similar to how Newton/Leibniz created calculus for physics.
Visualization: New tools act like Galileo’s telescope or Hooke’s microscope, revealing structures (isolated groups, influential participants) never seen before.
1.1.3 Social Media in the Enterprise (Internal Use)
Social media is not just for consumers (Facebook/Twitter); it is a “critical internal nervous system” for corporations.
Beyond the Firewall: Employees use wikis, blogs, and message boards to share documents and lower costs.
Business Value: SNA reveals the actual organizational structure versus the formal “org-chart.”
Key Roles Identified by SNA:
Bridges/Brokers: Individuals who connect otherwise separated departments.
Information Sources: People who serve as central hubs for knowledge.
Gartner Group Insights: SNA is an “untapped information asset” providing intelligence on:
1.1. Organizational Network Analysis: Internal ties.
Value Network Analysis: Vendor ties.
Influence Analysis: Consumer ties.
1.1.4 Collective Wealth & Risks
Bottom-Up Initiative: Individual contributions (edits, posts, likes) aggregate to create public wealth (e.g., Wikipedia, Open Source Software).
The “Forest vs. Trees”: Analysts must focus on individual behavior while understanding emergent properties (the collective whole).
The Dark Side: Social media can be used by criminals, for racial hatred, or by oppressive governments. Critics (like Jaron Lanier) warn of a loss of individual responsibility.
1.1.5 Applying SNA to National Priorities
Governments use social media to address large-scale challenges:
Disaster Response: Volunteer sites for Hurricane Katrina coordination or Wikipedia pages for the Virginia Tech shooting.
Community Safety: “Nation of Neighbors” (neighborhood watch) and “Amber Alert” (abducted children).
Collaborative Governance: “Peer-to-Patent” (citizens helping patent examiners) and “Citizen Science” (NASA’s “Be a Martian” or Encyclopedia of Life).
Information Dissemination: Rapid alerts for flu vaccinations or weather threats. People often trust friends/family on social media more than official TV broadcasts.
1.1.6 Global Perspectives & Research Agendas
Europe: Focused on “Public Services 2.0” to re-engage citizens in politics, though they note it “disrupts existing power balances.”
China: Focuses on foundations of social computing and cyber-physical systems.
Web Science: Aims to understand the web as a socio-technical phenomenon—acknowledging that the success of a site depends more on social rules and communities than just the hardware/software.
Sociotechnical Systems (STS): An approach that balances technology design with human needs and values to increase motivation and responsibility.
1.1.7 Practical Tools
NodeXL: (Network Overview Discovery and Exploration add-in for Excel).
A free, open-source tool designed for ease of use.
Allows non-programmers to visualize and analyze social media networks.
Summary Table: SNA Benefits by Role
Link to original
Stakeholder Benefit of Social Network Analysis Business Leaders Identify key contributors, find gaps in communication, and locate expertise. Marketing Directors Track compliments/complaints and guide product promotion. Government Agencies Disseminate health info, coordinate disaster response, and engage citizens. Researchers Evaluate which social strategies lead to success vs. failure using evidence.
SNA 1.2
Social Media - New Technologies of Collaboration
1.2.1 Introduction to the “Terrain of Interaction”
Sociotechnical Infrastructure: Social media platforms act like physical buildings. Just as a circular seating arrangement encourages different participation than rows, the design of a digital platform (e.g., Twitter vs. a Blog) influences how people interact.
Relational Data: Online tools produce massive amounts of data about who knows whom, who talks to whom, and where people hang out. This data is the foundation for Social Network Analysis (SNA).
Augmenting Intellect vs. Social Experience: Early pioneers (Bush, Engelbart) wanted to augment individual intellect; modern social media focuses on augmenting social experience and collective intelligence.
1.2.2 Social Media Defined
Definition: Online tools that support social interaction by transforming monologue (one-to-many) into dialog (many-to-many).
Core Function: Allows users to collaboratively create, find, share, evaluate, and make sense of information.
1.2.3 Social Media Design Framework
To compare different tools, the text provides six key dimensions:
Size of Producer and Consumer Population:
Small-to-Small: Instant Messaging, personal email.
Small-to-Large: Popular blogs, YouTube videos, celebrity tweets.
Large-to-Large: Wikipedia, eBay, massive multiplayer games (MMOs).
1.2. Pace of Interaction:
- **Asynchronous:** Email, forums (delayed, encourages careful contribution).

- **Synchronous:** Chat, IM, video calls (real-time, rich reaction).
3. Genre of Basic Elements: The type of “digital object” exchanged (e.g., 140-character tweets, photos on Flickr, 3D avatars in Second Life).
Control of Basic Elements: Barriers to entry (registration, credit card validation) and governance (centralized “benevolent dictators” vs. distributed systems like Usenet).
Types of Connections:
Explicit: “Friending” or “Following.”
Implicit: Inferred from behavior (replying to a post, “favoriting” a photo).
Directed vs. Undirected: Following on Twitter is directed (one-way); friending on Facebook is undirected (mutual).
Weight/Value: Measuring the intensity of a connection (e.g., 10 messages vs. 1 message).
Retention of Content: Ranging from permanent histories (Wikis) to fleeting, unrecorded exchanges (some IMs).
1.2.4 Social Media Examples & Networks Created
Category Key Property Type of Network Created Threaded Conversation Asynchronous; email, forums. Reply Graphs: Connects senders and receivers. Synchronous Real-time; Chat, IM, Texting. Conversation Networks: Based on active exchange. World Wide Web Hypertext; URLs. Hyperlink Networks: Analyzed via PageRank. Collaborative Authoring Wikis, Google Docs. Co-authorship Networks: People editing same pages. Microblogs Brief (140 chars); Twitter. Follower/Retweet Networks: Directed ties. Social Sharing Content-centric; YouTube, Flickr. Affiliation Networks: People connected by shared tags/interests. Social Networking Profile-centric; Facebook, LinkedIn. Social Graphs: “Friending” and professional ties. Online Markets Transactions; eBay, Amazon. Trade Networks: Connecting buyers and sellers. Idea Generation Voting/Challenge sites. Voting Networks: Who voted for which ideas. Virtual Worlds 3D Environments; Second Life, MMOs. Spatial/Proximity Networks: Who is near whom. Mobile/Location GPS-based; Foursquare. Geographical Networks: Connecting people to places.
1.2.5 Practitioner’s & Researcher’s Summary
For Practitioners: Success requires matching the specific tool dimensions to the desired audience and understanding the “etiquette” of that community.
For Researchers: We are in a “Golden Age” of social science. Challenges include:
Motivation: How to get people to participate voluntarily.
Governance: How to manage malicious behavior and community norms.
Scalability: Finding the limits of how large these networks can grow before they break down.
Link to original
SNA 1.3
Study Notes: Social Network Analysis (Chapter 3)
1.3.1 Introduction to Networks
Definition: A network is a collection of things and their relationships to one another.
Components:
Vertices (Nodes): The “things” connected (people, items, institutions).
Edges (Ties/Links): The connections between the vertices.
Purpose: Visualize complex relationships as maps (sociograms) and calculate precise measures of size, shape, and density.
1.3.2 The Network Perspective
Relational vs. Attribute Data: Traditional social science focuses on individual attributes (age, gender). Network science focuses on the connective tissue—the relationships between individuals.
Location, Location, Location: An individual’s success is often determined by their position within a structure rather than internal abilities alone.
Social Metrics: Recognizes patterns like “popularity” (many connections) vs. “influence” (connections to other well-connected people).
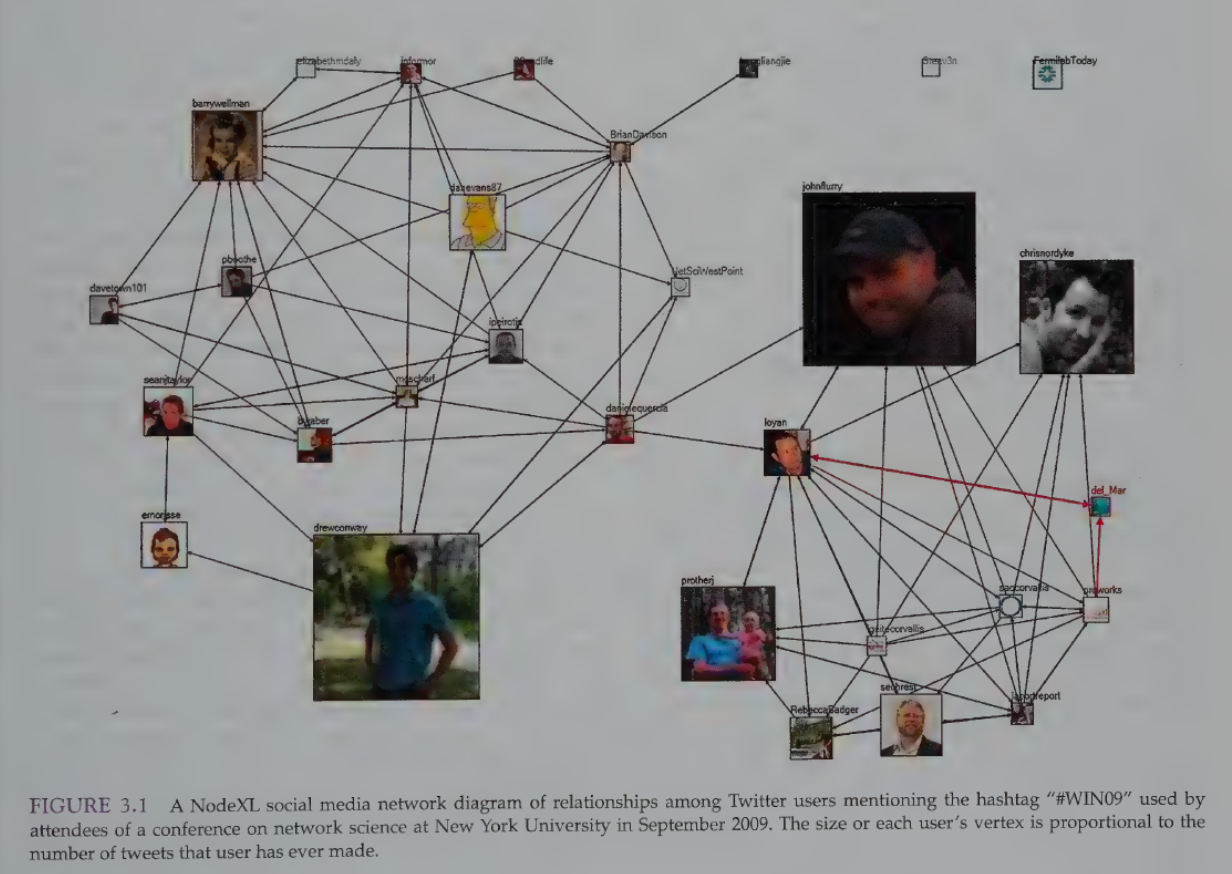
1.3.2.1 A Simple Twitter Network Example
Sociogram: A visual network graph.
Visual Overlay: Attribute data (like total tweet count) can be used to determine the size of a vertex in the graph.
1.3.2.2 Vertices and Edges
Vertex Attributes: Demographic data (race, age) or system data (logins, posts) can be mapped to visual properties like color or size.
Edge Types:
Directed (Asymmetric): Clear origin and destination (e.g., following someone on Twitter, sending an email). Represented by arrows.
Undirected (Symmetric): Mutual relationship with no direction (e.g., being Facebook friends, being married).
Unweighted (Binary): Simply shows if a tie exists (1) or not (0).
Weighted: Shows the strength or frequency of the tie (e.g., number of messages exchanged).
1.3.2.4 Data Representations
Adjacency Matrix: A table where rows and columns both represent individuals.
Edge List: A two-column list identifying pairs of connected vertices (Vertex 1 Vertex 2). This is the preferred format for NodeXL.
1.3.3 Types of Networks
Egocentric Networks: Focused on a single individual (Ego) and their connections (Alters).
1-degree: Ego + Alters.
1.5-degree: Ego + Alters + connections between those Alters.
2-degree: Ego + Alters + Alters’ friends.
Full vs. Partial: A full network includes everyone in a system; a partial network is a “slice” (e.g., users of a specific hashtag).
Unimodal vs. Multimodal:
Unimodal: One type of vertex (e.g., person-to-person).
Multimodal (Bimodal/Affiliation): Two or more types (e.g., people connected to the documents they edit).
Multiplex: Networks with multiple types of edges between the same vertices (e.g., two people who are both “coworkers” and “friends”).
1.3.4 & 1.3.5 Network Analysis Metrics
1.3.5.1 Aggregate Metrics (Whole Network)
Density: The percentage of all possible connections that actually exist. Measures cohesion.
Centralization: Measures how much the network revolves around a few key nodes.
1.3.5.2 Vertex-Specific Metrics (Individual Positions)
Degree Centrality: Simple count of total connections.
In-degree: Connections pointing to the vertex (popularity).
Out-degree: Connections pointing away (sociability).
Betweenness Centrality: Measures how often a vertex acts as a bridge on the shortest path between others. High scores indicate a broker role.
- Structural Hole: A gap between two groups; the person who fills this gap has high strategic value.
1.3. Closeness Centrality: The average distance (number of hops) from a vertex to all others. Low scores mean you are “close” to everyone.
Eigenvector Centrality: Influence score. You are central if you are connected to other highly central people (e.g., Google’s PageRank).
Clustering Coefficient: Measures the density of an individual’s 1.5-degree network (do your friends know each other?).
1.3.6 - 1.3.9 Historical and Technical Context
Small World Phenomenon: “Six Degrees of Separation”—most nodes can be reached in a small number of steps.
Weak Ties: Mark Granovetter’s theory that “weak ties” (acquaintances) are more useful for finding new information/jobs than “strong ties” (close friends).
Dunbar’s Number: The theoretical biological limit of ~150 stable social relationships.
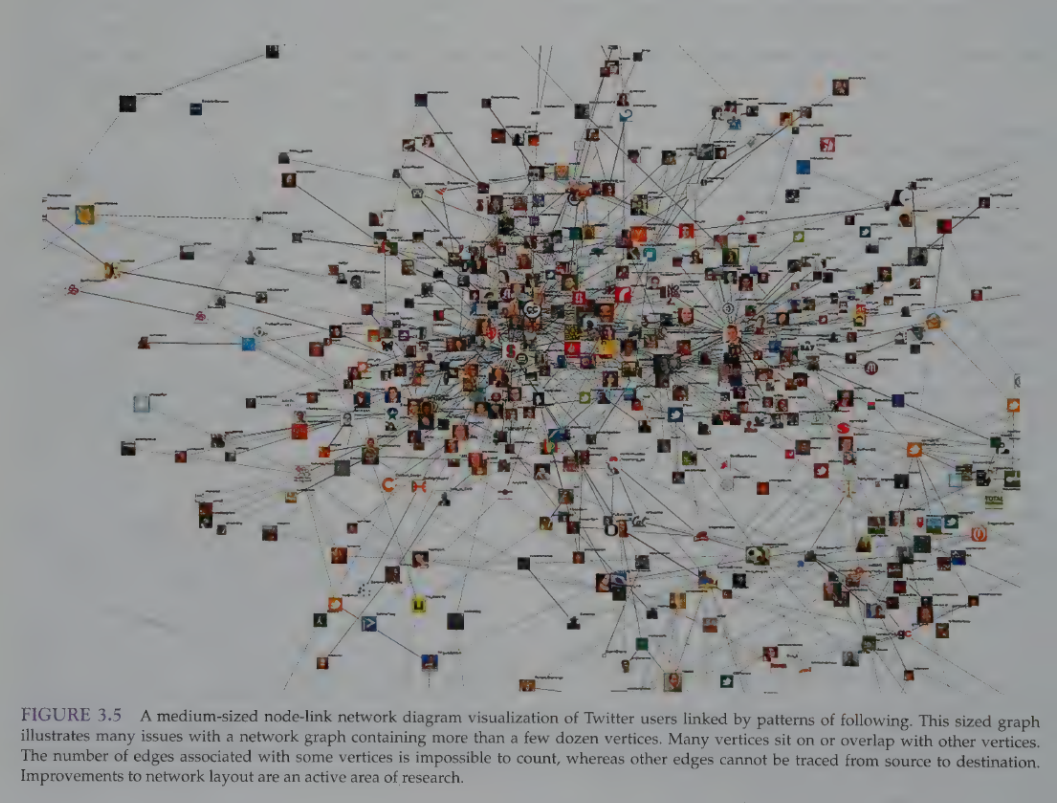
Netviz Nirvana: The ideal state of a visualization where every vertex/edge is visible, clusters are identifiable, and outliers are clear.
1.3.10 Common Exam/Research Questions
Social Roles: Who is the “Answer Person” or the “Boundary Spanner”?
Influencers: Who helps new ideas propagate?
Community Health: How do structures change after events like layoffs or mergers?
Study Tip: Focus on the difference between Betweenness (brokering/bridging) and Eigenvector (influence by association). These are common points of confusion in SNA exams.
Link to original