Getting Started with NodeXL, Layout, Visual Design, and Labeling
2.1.1 Introduction to NodeXL
-
Purpose: NodeXL is an open-source extension for Microsoft Excel designed to make Social Network Analysis (SNA) and visualization accessible to non-programmers.
-
Structure: It uses a structured workbook template with multiple worksheets:
-
Edges: Stores the “edge list” (pairs of connected vertices).
-
Vertices: Stores information about individual nodes (color, size, shape, etc.).
-
Clusters/Groups: Information about subsets of the network.
-
-
Scale: Typically supports networks of several thousand vertices (up to tens of thousands for some users).
2.1.2 Installation and Setup
-
Requirements: Windows Excel 2007 or 2010. (Not compatible with Mac Excel or older Windows versions).
-
Source: Downloadable from the Codeplex site (www.codeplex.com/NodeXL).
-
Opening: Access via the Start Menu or as an Excel Template (
NodeXLGraph.xlsx).
2.1.3 Basic Data Operations
-
Data Entry: You can manually type “Vertex 1” and “Vertex 2” names to create relationships.
-
Show Graph: Clicking “Show Graph” renders the data in the Graph Pane.
-
Highlighting: Clicking a row in the spreadsheet highlights the corresponding edge/vertex in the graph.
-
Importing: Data can be imported from:
-
Existing files (Pajek, UCINET, GraphML).
-
Social Media (Twitter, YouTube, Email collections).
-
Copy-pasting from other Excel sheets.
-
2.1.4 Layout (Arranging Vertices)
-
Automatic Layouts:
-
Fruchterman-Reingold: The default “force-directed” layout.
-
Circle: Arranges nodes in a circle; useful for reducing edge crossings in small networks.
-
Sugiyama / Harel-Koren: Other advanced algorithms for specific patterns.
-
-
Graph Types:
-
Undirected: Symmetric relationships (e.g., “Friends”).
-
Directed: Origin to destination (e.g., “Invitations”). Represented by arrows.
-
-
Manual Control:
-
Manual Layout: Dragging nodes with the mouse to emphasize specific structures.
-
Fixing/Locking: Vertices can be “Locked” via the Vertices worksheet (X and Y coordinates) to prevent them from moving during a refresh.
-
-
Navigation: Use the Zoom slider for detail and the Scale slider to adjust the size of all elements simultaneously.
2.1.5 Visual Design (Attributes)
-
Vertex Colors: Controlled by the “Color” column in the Vertices worksheet (uses standard CSS names like “Pink” or “Blue”).
-
Descriptive (Attribute) Data: Users can add custom columns (e.g., Age, Prior Party Attendance) to the right of the Vertices worksheet.
-
Autofill Columns: A powerful tool to map data to visual properties automatically.
- Example: Mapping “Number of Prior Parties” to “Vertex Size.”
-
Options Dialog: Allows setting the range (e.g., setting Min size to 2.1.5 and Max to 6.0) to prevent overlap or invisibility.
-
Legend: Automatically generated when using Autofill to help interpret the graph’s visual coding.
2.1.6 Labeling and Shapes
-
Vertex Labels:
2.1. Label as Shape: The text is the vertex; color and size apply to the text box.
-
Label alongside Shape: Text appears next to a shape (e.g., a Disk).
-
Tooltip: Text only appears when hovering over the node with a mouse.
-
-
Label Customization:
-
Label Fill Color: Sets the background of the text box.
-
Label Position: Can be set (Top, Bottom, etc.) to reduce clutter.
-
-
Images as Vertices: You can use image URLs or file paths in the “Image File” column to replace dots with profile pictures.
-
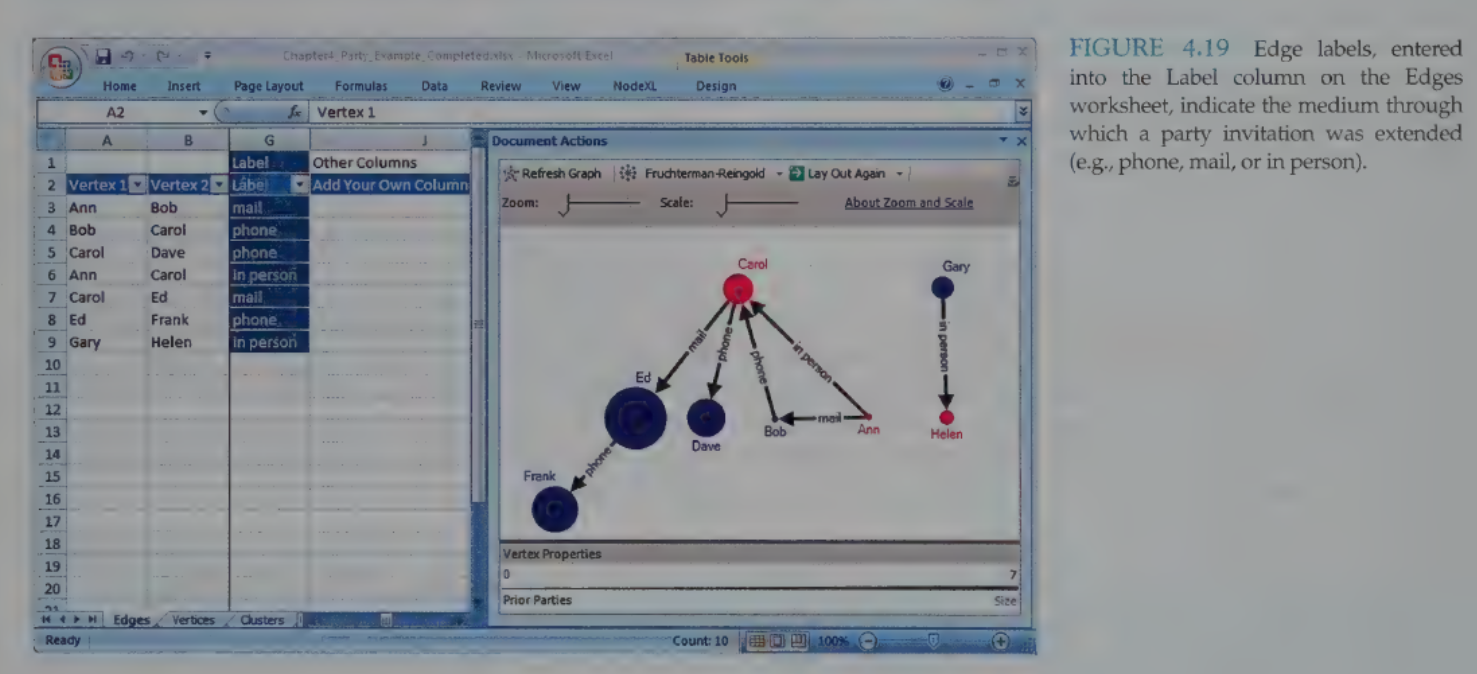
Edge Labels: Added via the “Label” column in the Edges worksheet to describe the relationship (e.g., “Phone call” vs. “Email”).
2.1.7 Practitioner’s Summary
-
NodeXL’s primary advantage is its integration with the spreadsheet paradigm, making it easy for business analysts to use familiar formulas and filtering while generating professional network visualizations.
-
The Autofill feature is the bridge between raw data and meaningful visual patterns.
2.1.8 Researcher’s Agenda
-
NetViz Nirvana: The research goal of reaching an ideal state where every node is visible, every degree is countable, and every edge can be followed.
-
Current Research Focus:
-
User performance on benchmark tasks (e.g., “How fast can a user find a cluster?”).
-
Automating layout while maintaining readability.
-
Developing task-specific aesthetics for directed vs. undirected graphs.
-